Research step: Survey
- Jennifer Kwon

- Dec 10, 2018
- 7 min read
About the survey:
In order to know how people control their emotions and analyze why people feel relieved after taking those actions, I designed a survey and ran this survey in my school on MYP and DP students and teachers. I basically printed 65 sheets of survey paper and went to every homeroom class, tell students to fill the survey sheet and give them back to me when they finish. I also went to some teachers’ rooms in order to see some thoughts of adults on controlling emotions.
In order to get quick results, I provided options under every question, so it helps people answer questions quickly and easily and helps me at the same time to analyze results. There was an option ‘None of them above’ and I put blank beside that option so people could write their own answers in that blank. I also put one question about the design of websites, so I can know what people consider the most important about websites.
I allowed people to choose more than one answer, therefore, I counted the number of answers I got on each question and classify them by the answers. Then I calculated the percentage and put them in the visual format (different types of charts). Based on the results I got from this survey, I will research scientific reasons such as what happens to a human body when people take those actions to control emotions.


Survey result Analysis

The graph on left hand side indicates the nationalities variation of people who answered on this survey. I got 56 sheets of paper back, and among them, survey sheets of Korean were 26, Chinese were 12, 2 people were from South Africa, 2 people were from New Zealand, 4 people were from USA. There was one person from Malaysia, Thailand, India, Canada, Colombia, UK, Serbia, Turkey, Singapore and Ireland. According to the graph, I can easily know that many Korean people participated in this survey.
Information on right hand side indicates the age variation of people who answered on this survey. There were 25 people aged 10-15 among 56 people, 17 people aged 16-20, 4 people aged 21-30, 3 people of age 31-40, 2 people who are in age group 41-50 and 5 people of age 51 over. According to the percentage on the right side, most participants are involved in age group 10-15.

I provided three options which are ‘Way of responding to demand or threat’, ‘Depression’ and ‘Anxiety’. I got 67 answers from this question. Option ‘Depression’ got 14 choices, ‘Way of responding to demand or threat’ got 16 choices, ‘Anxiety’ got 31 choices and 6 answers were ‘None of them above’. 6 ‘None of them above’ includes ’Living life’, ‘School’, ‘Motivation’, ‘Wall’, and 2 no answers.
On the right side, visual format of information is shown. Size of human icon indicates the percentage. I can clearly see that most of the people chose ‘Anxiety’ as their stress.

I provided eight options which are ‘Study’, ‘Family’ and ‘Friends’, ‘Money’, ‘Child’, ‘Work’, ’Future’, ‘None of them above’. I got 109 answers from this question. Option ‘Study’ got 30 choices, ‘Family’ got 10 choices, ‘Friends’ got 6 choices, ‘Money’ got 9 choices, ‘Child’ got 3 choices, ‘Work’ was chose 20 times, ’Future’ got 27 choices and 4 answers were ‘None of them above’. 4 ‘None of them above’ has ‘Pressure’, ‘Marriage’, ‘Rushing to finish work’, ’Too much amount of work’ and ‘Thinking’.
The graph on the right side clearly shows which option got the most choices by people. The most chosen option was ‘Study’ and the least chosen option was ‘Child’.

I provided options which are ‘Depression and anxiety’, ‘Sleeping problems’, ‘Frequent diseases’, ‘Skin conditions’, ‘Weight issues’. ‘Digestive problems’. ‘Anger’ and ‘None of them above’. I got 100 answers under this question. ‘Depression and anxiety’ got 31 choices, ‘Sleeping problems’ got 25 choices, ‘Frequent diseases’ got 7 choices, ‘Skin conditions’ got 8 choices, ‘Weight issues’ got 8 choices. ‘Digestive problems’ 4 choices. ‘Anger’ got 16 choices and ‘None of them above’ had 1 vote. 1 ‘None of them above’ was ‘No effect’.
The pie chart indicates those information in percentage. It is clearly shown that the blue part is the biggest, red part is the smallest. ‘Depression and anxiety’ was the most chosen answer while ‘None of them above’ was the least chosen answer.

I provided options which are ‘Exercise’, ‘Writing diary’, ‘Watching movies’, ‘Reading books’, ‘Yoga’. ‘Listening to music’. ‘Meditation’, ‘Talking to close friends/ family members’ and ‘None of them above’. There were 100 votes under this question. ‘Exercise’ got 16 votes, ‘Writing diary’ got 2 votes, ‘Watching movies’ had votes from 15 people, ‘Reading books’ had 9 votes, ‘Yoga’ got 2 votes from participants, ‘Listening to music’ had 26 votes. ‘Meditation’ had 2 votes, ‘Talking to close friends/ family members’ had 23 votes and ‘None of them above’ were chosen 5 times. ‘None of them above’ includes ’Watching Youtube videos’, ‘Playing computer games’, ‘Eating spicy food’, and ‘Sleeping’ was chosen two times.
The pie chart indicates number of votes in percentage. It is clearly shown that ‘Listening to music’ got the most number of votes and ‘Writing diary’, ‘Meditation’, and ’Yoga’ got the least number of votes.

I provided 4 options under this question. Options are ‘It is a relief of anxiety.’, ‘It helps me to forget about worries and anxiety’, ‘It helps me to find out what factors cause those emotions’, ‘None of them above’. I got 68 answers in total. Option ‘It is a relief of anxiety’ got 23 votes, ‘It helps me to forget about worries and anxiety’ had 35 votes, ‘It helps me to find out what factors cause those emotions’ got 6 choices and ‘None of them above’ were chosen 4 times. ‘None of them above’ includes ‘I feel better after I take those actions’, ‘It makes me laugh’, and 2 ‘No answer’s.
I used an icon size to indicate the percentage of each option. Since ‘Forget about worries and anxiety’ has the biggest icon, it means it is the most chosen option while ‘None of them above’ is the least chosen answer.

Options under this question were ‘Exercise’, ‘Yoga’, ‘Listening to music’, ‘Meditation’, ‘None of them above’. I got 67 answers in total. ‘Exercise’ had 14 choices, ‘Yoga’ had 13 votes, ‘Listening to music’ was chosen 24 times, ‘Meditation’ got 9 votes, and ‘None of them above’ had 7 votes. ‘None of them above’ includes ’No answer’, ‘Watching movies’, ‘Sleeping’, ‘Resting’, ‘Chatting with friends’ and ’Quitting school’.
I transformed data into percentage and made a graph on right hand side. Since I can easily notice that ‘Listening to music’ is the highest one, I definitely know that ‘Listening to music’ got the most number of votes while ‘None of them above’ is the shortest, I can know that ‘None of them above’ got the least amount of votes.

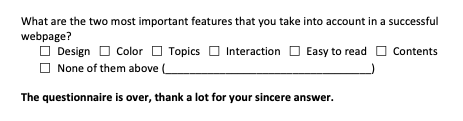
I provided 7 options under this question which are ‘Design’, ‘Color’, ‘Topics’, ‘Interaction’, ‘Easy to read’, ‘Contents’ and ‘None of them above’. I got 109 votes from this question. ‘Design’ got 30 votes, ‘Color’ got 5 choices, ‘Topics’ was chosen 14 times, ‘Interaction’ had 8 votes, ‘Easy to read’ got 23 votes, ‘Contents’ was chosen 27 times and ‘None of them above’ got 2 votes. ‘None of them above’ had 2 votes which are ‘No answer’ and ‘Diagrams and pictures’.
I transformed numerical data into percentage and transformed that into a visual format. The pie chart on right side indicates the results in percentage. ‘Design’ takes the largest area which means that ‘Design’ was chosen for the most number of times. ‘None of them above’ got the least amount of votes, so it takes the smallest area in the pie.
Survey Evaluation and Extension:
Evaluation:
Even though I got most of the survey sheets back and I could analyze the results successfully, there are several points that I should improve.
First, I should have done basic research before I make the survey sheet, so I can put more efficient and outbreaking questions on the survey sheet. I tried to do some basic research to get a general knowledge about controlling emotions, but I was in a rush to make a survey sheet before the break, I could not finish the research. So I needed to put some general questions rather than new and helpful questions for me.
Second, I should have provided people with more detailed description about the survey. Since I was in a rush to finish and get survey back in time, I could not have good description about the survey. I think this could have made confusion to participants because they might now know what ‘Personal Project’ is.
Since the survey is done successfully, I think there were few things that I went right.
First of all, I made the survey sheet super easy. I did not plan to provide options under every question because I did not know which option I should give to people. However, my supervisor suggested me to put options so I put some easy and general options. This made the survey easy which was the main reason why I could successfully gather almost every survey sheet I handed out to people.
Second, I think I made quite good survey sheet in terms of description and the general survey format. I explained myself, why I am running this survey, objective of the survey, What questions are about, how many questions they need to answer. I also put a line ‘This study is intended for educational purpose only, and not for any commercial purposes’ in order to prevent misunderstanding of people. I think this worked quite well and I could conclude my survey successfully.
Extension:
This time, I made a survey about how people think of stress and how they control emotions. There are some ways to extend this topic and this survey to other areas.
Design a survey asking how people think emotions are made and if they can control emotions easily.
Design an experiment to see whether controlling emotions methods actually work.


Comments